Return to User Guide Table of Contents
Select and Download Data
The IHGIS Data Finder guides you through the process of creating a customized data extract consisting of selected data tables and accompanying metadata. You will browse available data tables by dataset, select the tables you wish to download, review and submit your extract request, and download your extract.
Apply filters
IHGIS offers two types of filters, Datasets and Tabulation Geographies. You can use either or both of these filters to narrow down the list of tables shown in the data selection grid.
Note: Filters only affect which tables are shown in the data selection grid. They do not affect your data table selections or data cart. So you can filter on one dataset, select tables from that dataset, change the filter to a different dataset (removing the first dataset from the filters), and retain the tables you selected from the first dataset in your cart.
Filter by dataset
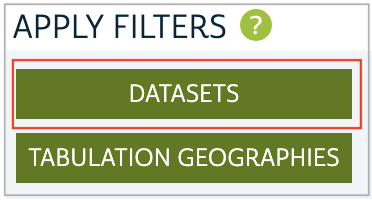
Click the green “DATASETS” button to choose one or more datasets to browse. This will open the datasets filter pane.
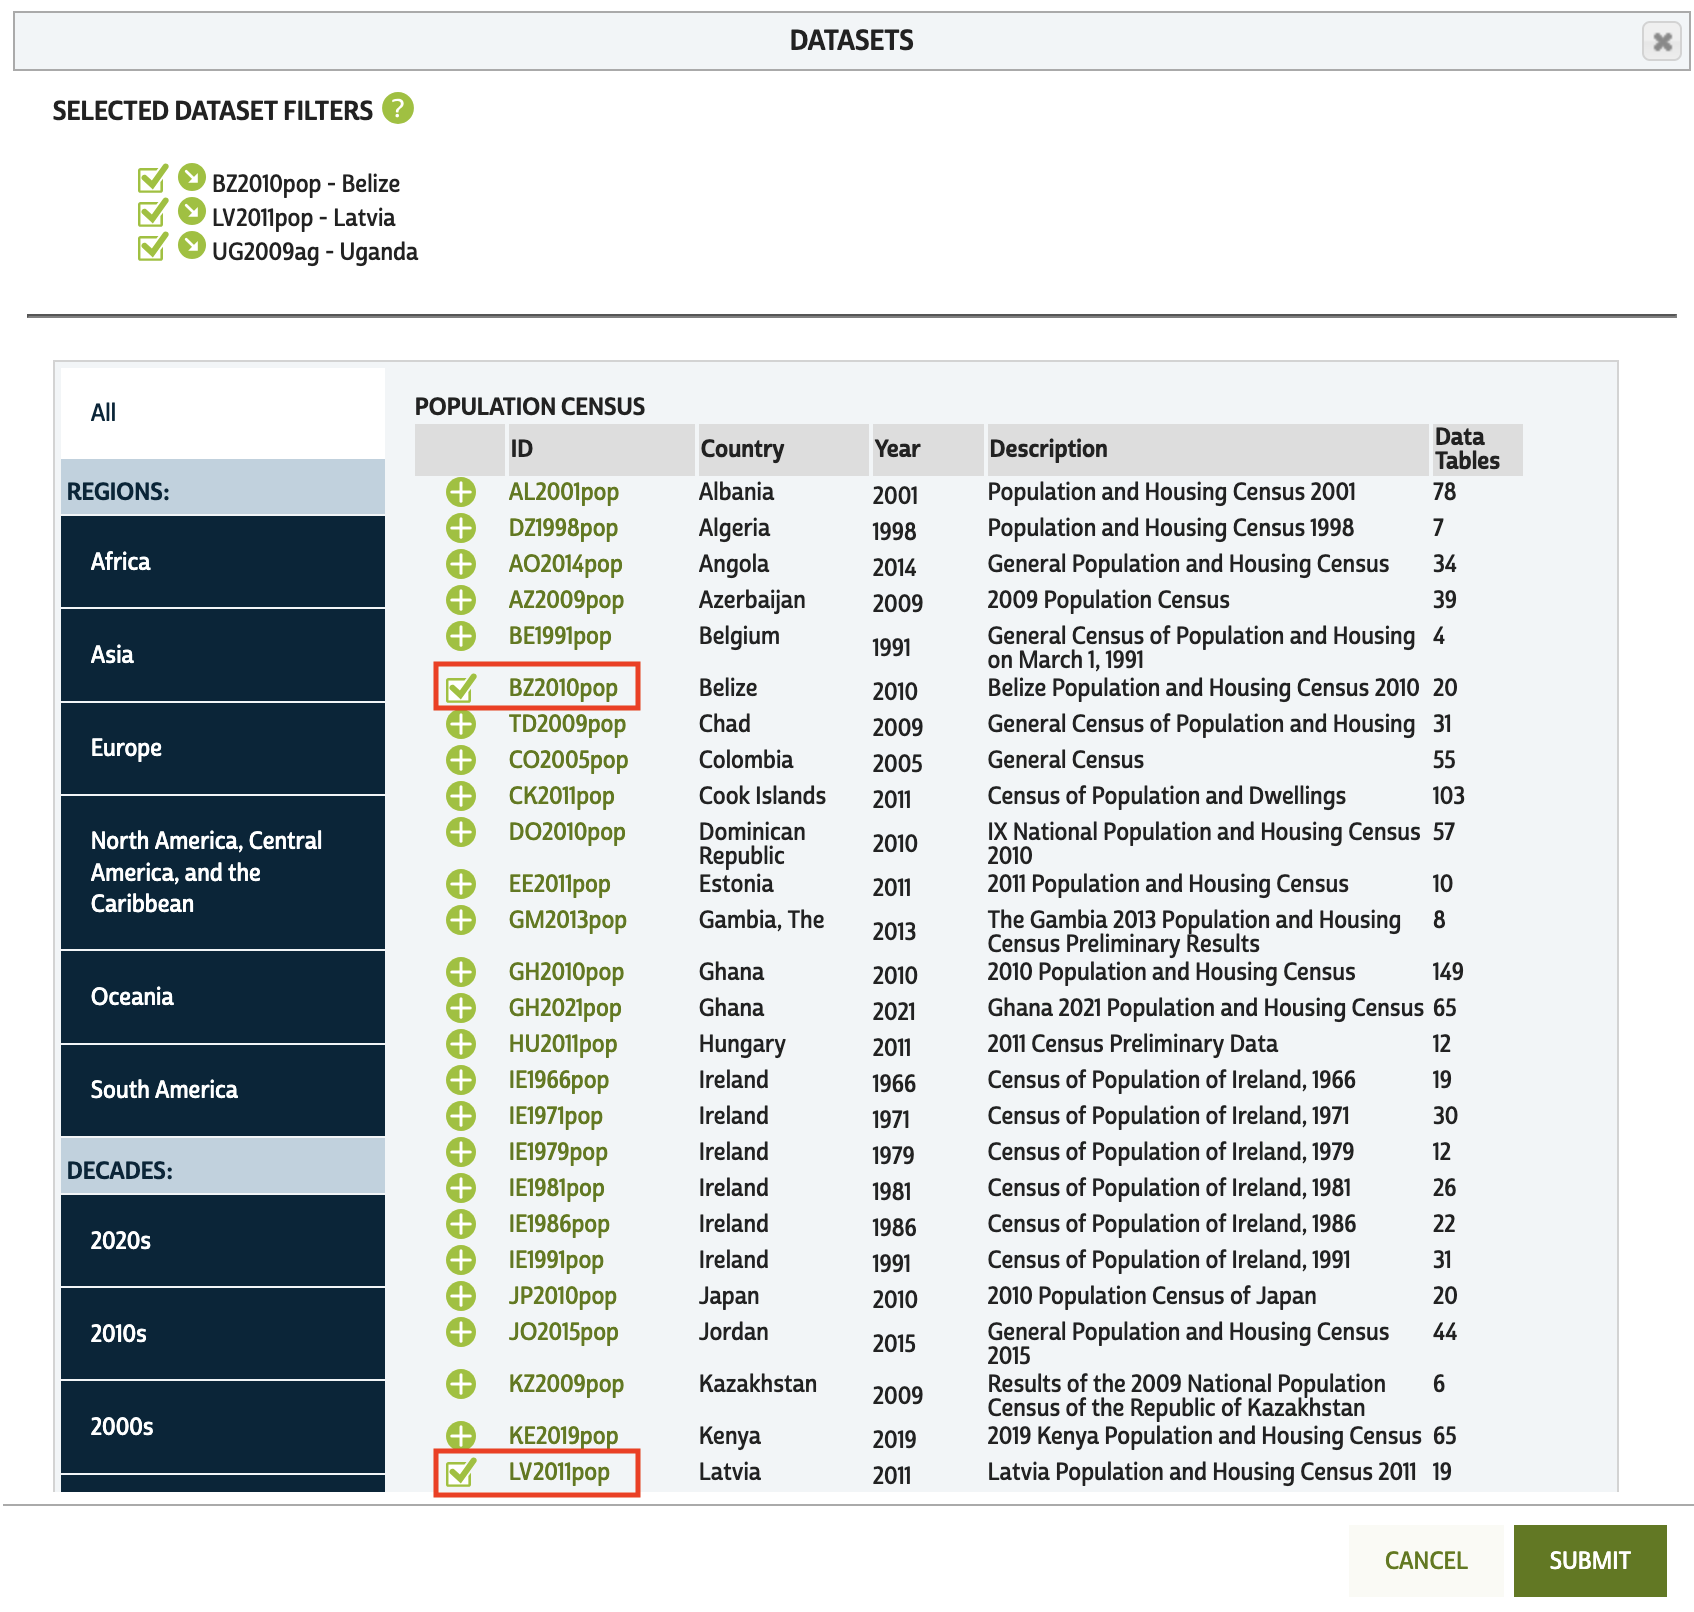
Datasets are organized by type, including Population Census, Agricultural Census, and Microdata Sample Tabulations. You can filter datasets by world Region or by Decade by using the tabs on the left side of the filter pane. For each dataset, the ID, country, year, description/title, and number of data tables available are shown.
Click the green ‘+’ next to each dataset you wish to browse. The '+' will then change to a check mark. For example, let's select the BZ2010pop (Belize), LV2011pop (Latvia), and UG2009ag (Uganda) datasets. Click “SUBMIT” to close the filter panel and return to the list of tables narrowed to the selected datasets.
NOTE: The round green question mark icons throughout the site link to additional information about features of the interface.
Filter by tabulation geography
Tabulation geographies are sets of geographic units for which census data are tabulated. Tabulation geographies are organized in hierarchies, with smaller units (e.g., counties, districts) nested within larger units (e.g., states, provinces). In IHGIS, levels of the hierarchy are numbered with the coarser units having smaller numbers and finer units having larger numbers. For example, g2 units nest within g1 units. Some datasets also include tabulation geographies that do not fit within the standard hierarchy, such as urban centers or historical configurations of units. These tabulation geographies are called nonstandard hierarchical levels and are designated with letters, e.g., ‘ga.’
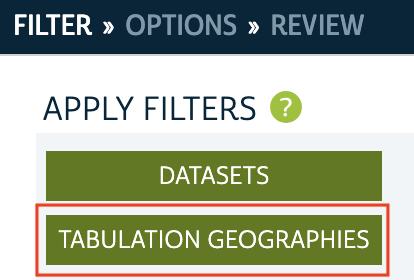
To display only tables that are available for particular tabulation geographies, click the “TABULATION GEOGRAPHIES” filter button to open the tabulation geographies filter pane. If you have applied a dataset filter, the tabulation geographies associated with those datasets will be listed. For the three datasets in our example, eleven tabulation geographies are available. The list of tabulation geographies includes the dataset, country, year, hierachical level code (e.g., g1, g2), name of the tabulation geography (e.g., Districts, Subdivisions), number of units, mean population and mean area of the units, and the number of data tables available for the tabulation geography.
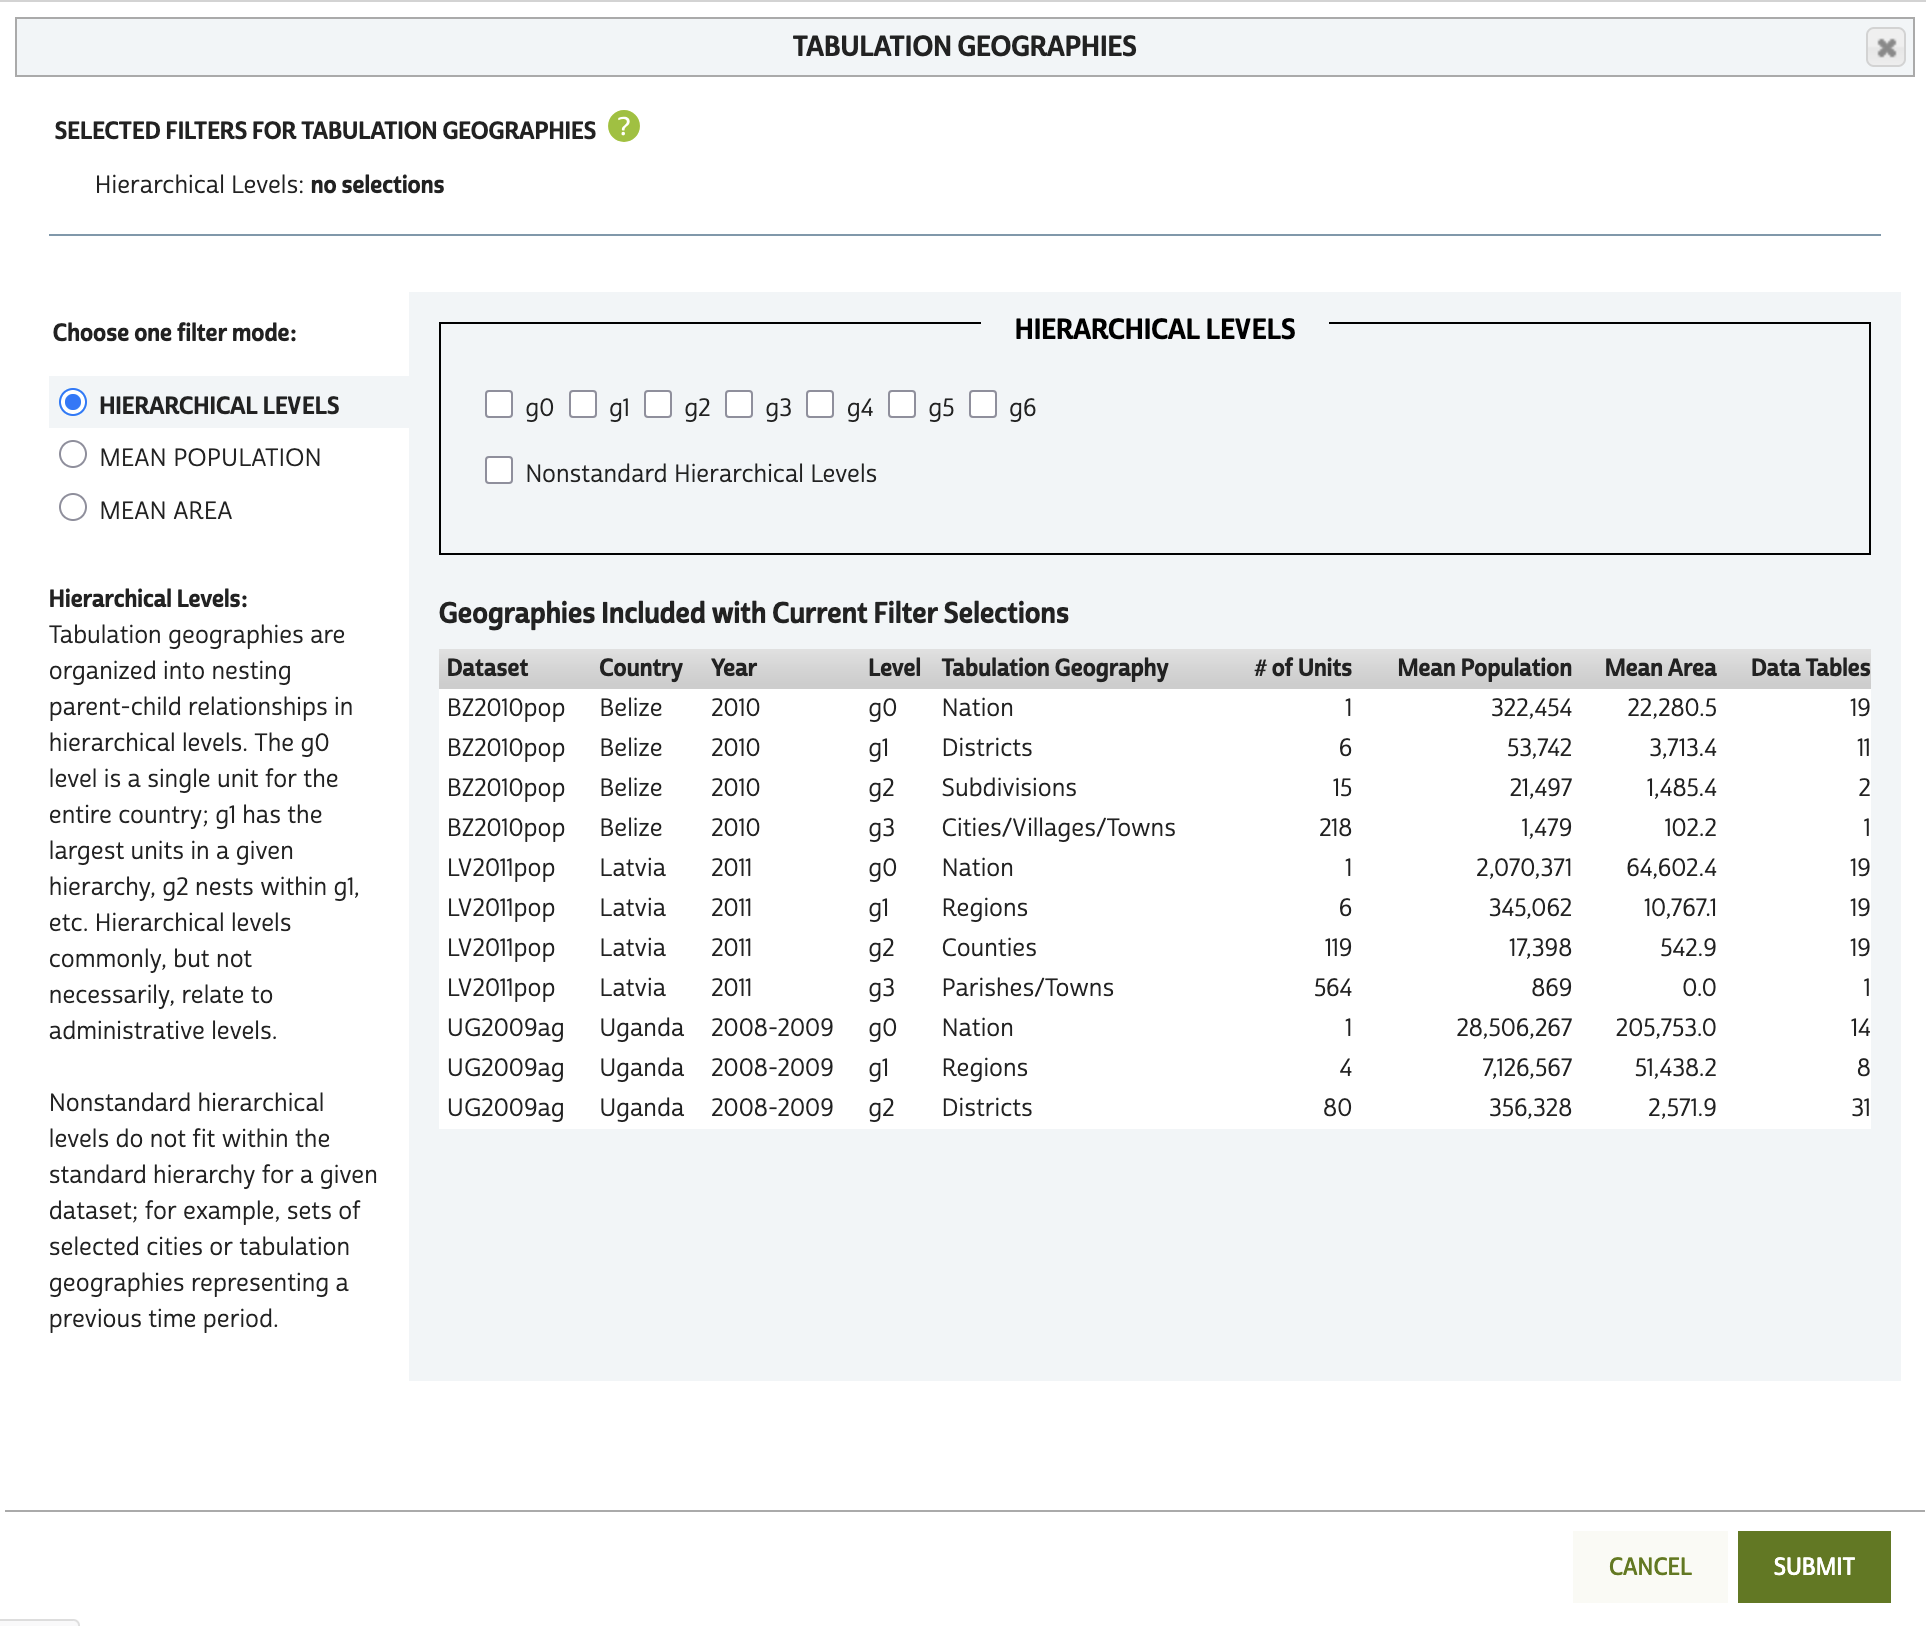
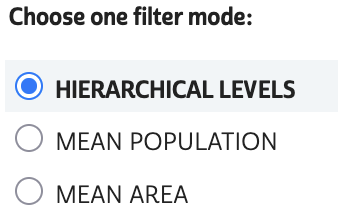
Tabulation geographies can be filtered based on hierarchical level, mean population, or mean area.
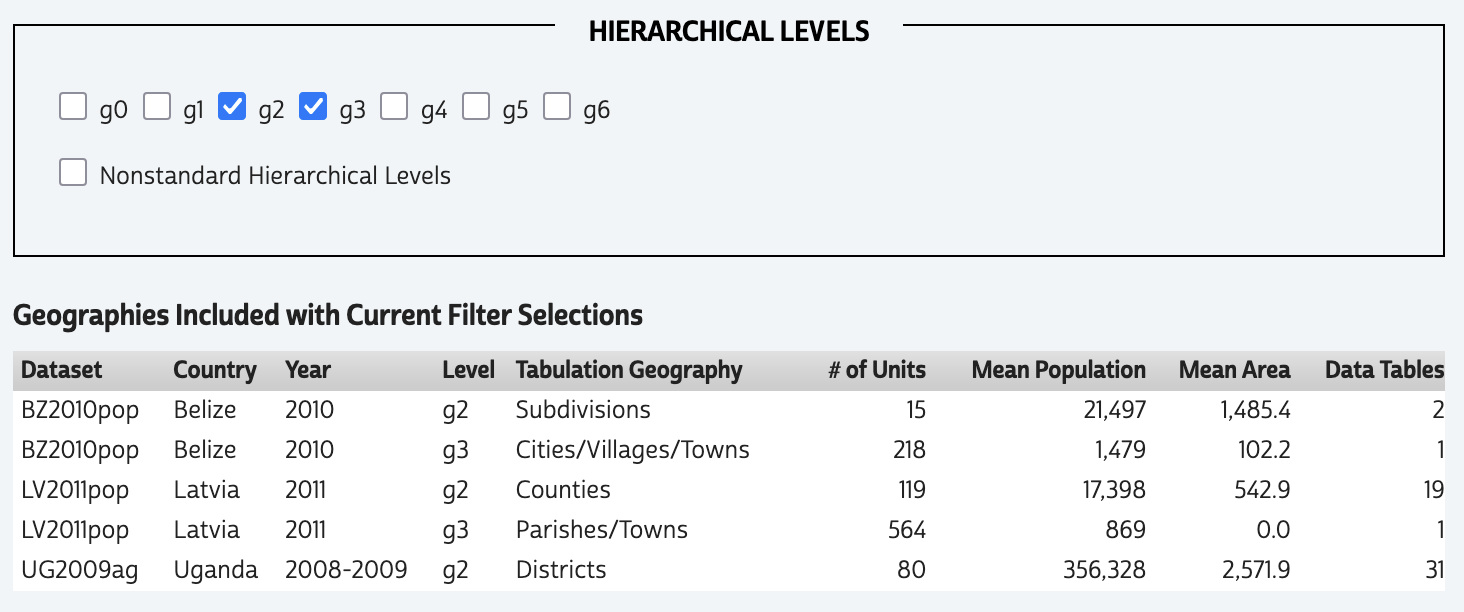
To filter on hierarchical levels, click the check boxes for the level(s) of interest. This will narrow the list of tabulation geographies in the filter pane to just the selected hierarchical levels. For example, selecting the g2 and g3 hierarchical levels narrows the list of tabulation geographies from eleven to five.
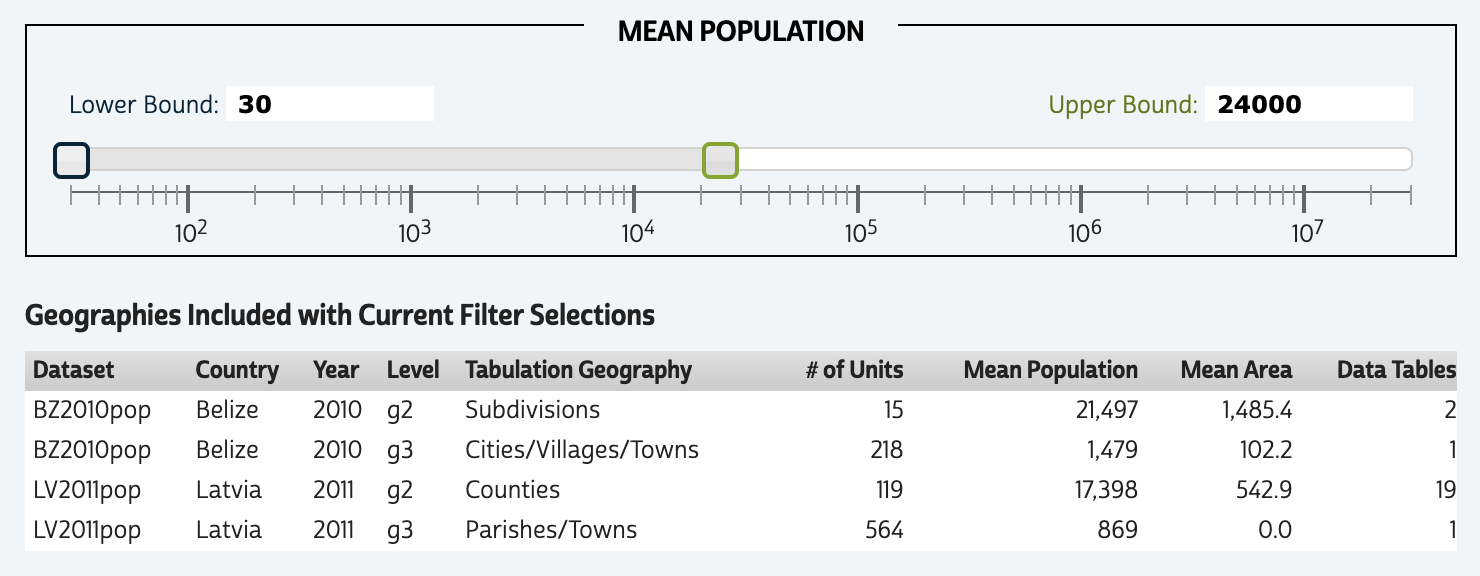
To filter based on mean population or mean area, click the corresponding radio button. This will switch the filter mode from hierarchical level check boxes to a slider bar allowing you to select a lower and upper bound. For example, selecting a mean population range of 30 to 24,000 narrows the list to four tabulation geographies. Note that the slider uses a logarithmic scale.
Means are calculated across the units in each tabulation geography. For standard hierarchical levels, in which the units exhaustively cover the country, the mean is effectively the total population or area of the country divided by the number of units in the tabulation geography.
Note that only one filter mode—hierarchical level, mean population, or mean area—can be applied at a time. Click “SUBMIT” to close the filter panel and view tables that are available for the tabulation geographies meeting the selected criteria.
Select tables
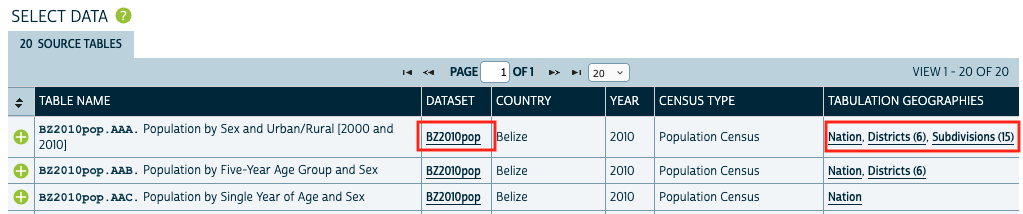
After applying dataset and/or tabulation geography filters, data tables available for those datasets/geographies will be listed in the “SELECT DATA” grid. For the Belize, Latvia, and Uganda datasets and tabulation geography mean population between 30 and 24,000, twenty-two tables are available. You can change the number of tables listed in each page of the grid with the dropdown at the top and bottom center.
Add data tables to your cart by clicking the green ‘+’ on the left side. Let's add tables BZ2010pop.AAD, LV2011pop.AAA, and LV2011pop.ABC. The pluses will change to green check marks. You can remove tables from your cart by clicking the check mark.
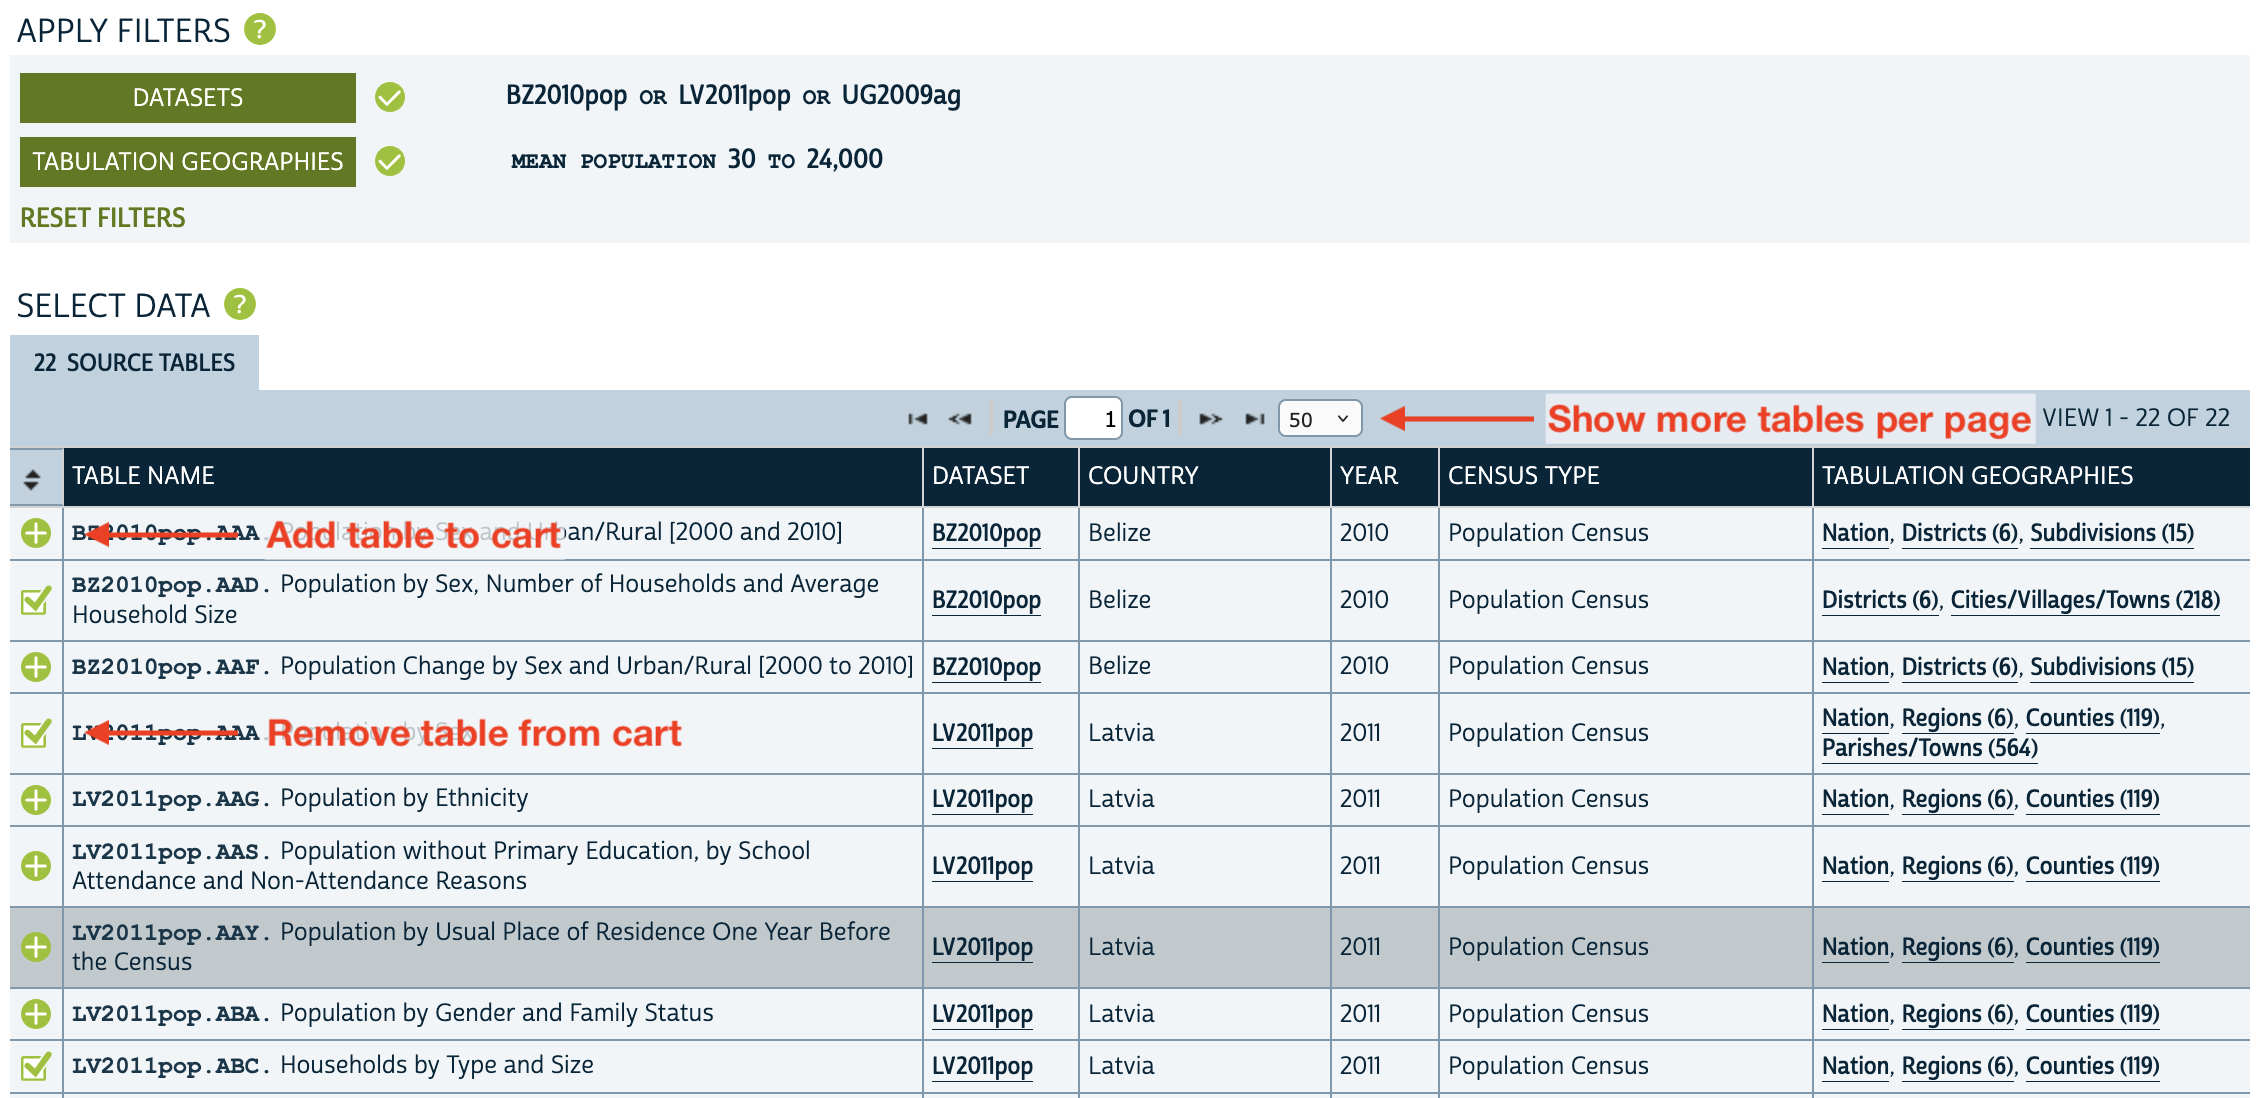
For each table, the table name, dataset, country, year, census type, and available tabulation geographies are listed. You can also view metadata about the datasets and tabulation geographies by clicking the links in those columns. See the View Metadata section for more detail.
Data cart
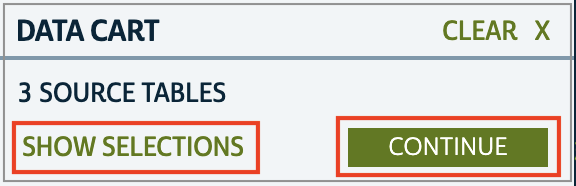
The tables you select will appear in your Data Cart. If you wish to review your selections, click “SHOW SELECTIONS,” which will open a view similar to the Select Data grid, showing only the tables you have selected. You may remove tables from your cart by clicking the green checkmark in this view.
To move to the Options step, click "CONTINUE" in the Data Cart.
Data options - Select tabulation geographies
In the Data Options step you will select the tabulation geographies you want to include in your extract. You will receive one file for each selected tabulation geography/table combination (provided the tabulation geography is available for that table). This structure facilitates joining to GIS files of the unit boundaries for mapping and spatial analysis.
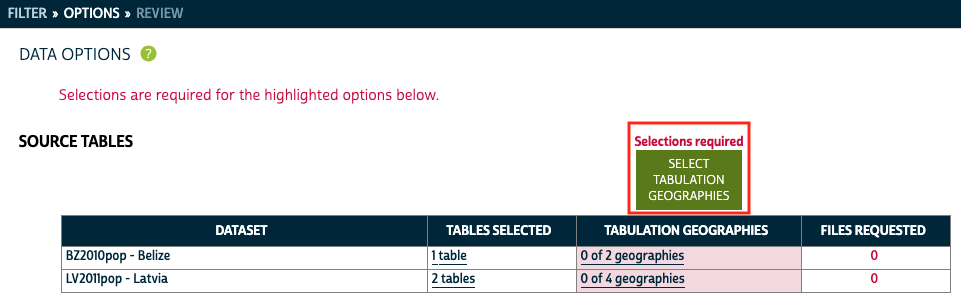
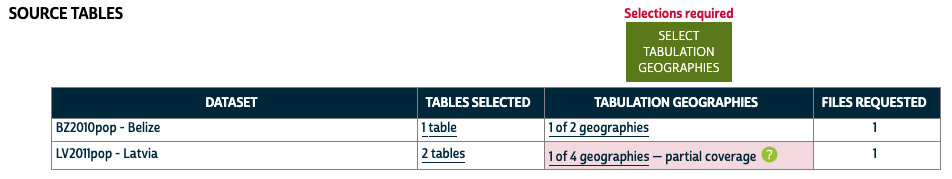
If tabulation geography selection is required, red alert text will appear at the top of the page and above the "SELECT TABULATION GEOGRAPHIES" button. Additionally, the Tabulation Geographies column in the table summarizing your data selections will be highlighted in red for datasets requiring selections. Click the “SELECT TABULATION GEOGRAPHIES” button to to open the Tabulation Geographies Selection panel.
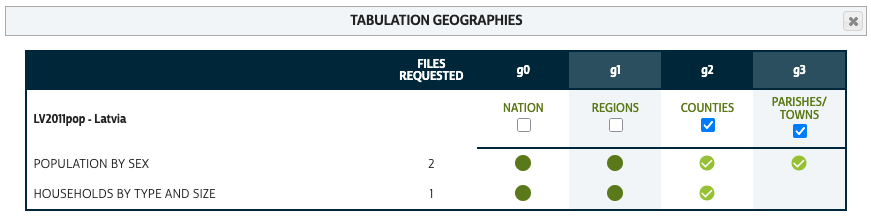
The Tabulation Geographies Selection panel includes checkboxes in the header that can be used to select hierarchical levels for all datasets. For example, checking the g3 box in the header selects cities/villages/towns for Belize and parishes/towns for Latvia. The sections for each dataset also include checkboxes that can be used to select geographies for just that dataset.
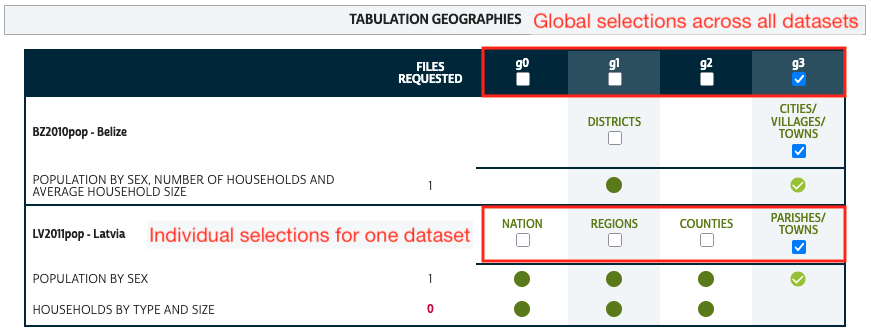
Each green check mark represents a tabulation geography/table combination for which you will receive a data file. You must select at least one available tabulation geography for each table in your cart. Tables for which no available tabulation geography has been selected will have a red “0” under “Files Requested” in the Tabulation Geography Selection pane. In our example, the Latvia "Households by Type and Size" table is not available for g3, so the row for that table has no green check marks and zero files requested.
On the Data Options page, you will be alerted about tables without available tabulation geographies selected with red shading on their dataset's row and a “partial coverage” indicator.
You can open a Tabulation Geography Selection pane for an individual dataset by clicking the “X of Y geographies” link. This pane will show only the tabulation geographies for that dataset, and will not include the global selection options. Let's add counties (g2) to the selection for Latvia so both tables are covered.
If you had a tabulation geography filter applied when you added a table to the Data Cart, tabulation geographies meeting the filter criteria will be selected by default. Because tabulation geography selections are applied at the dataset level, the geographies will also be selected for any other tables in the dataset.
The Data Options page also allows you to view a summary of your selected tables and their available geographic levels for each dataset by clicking the “X tables” link under Tables Selected. This opens a panel listing the title, available tabulation geographies, and number of files requested for each table.
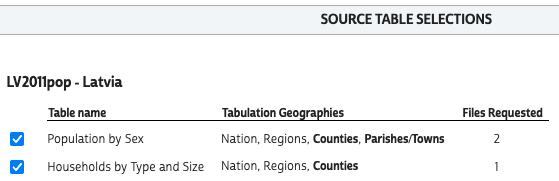
Tabulation geographies in bold have been selected. You can remove a table from your Data Cart by clicking the blue check mark.
Move to the final Review and Submit step by clicking “CONTINUE” in the Data Cart.
Review and submit
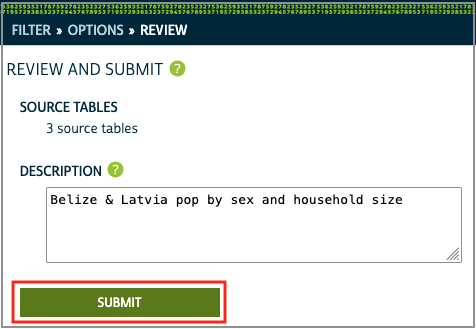
You may enter a description of your selections as a reminder of what is included in your extract. This description will appear on the downloads page.
Click “SUBMIT” to start processing your extract. You must be logged in to submit an extract. If you are not already logged in, you will be prompted to do so.
You will receive an email notification when your extract is ready to download. (Most IHGIS extracts should complete within a few minutes.)
Download your extract
After submitting your extract, you will be taken to your Extracts History page. This page lists all the IHGIS extracts you have made, including the extract number, date created, status, links to download the data and revise the extract, and the description you entered.
When your extract is complete, download your data by clicking the “TABLES” link under “DOWNLOAD DATA.”
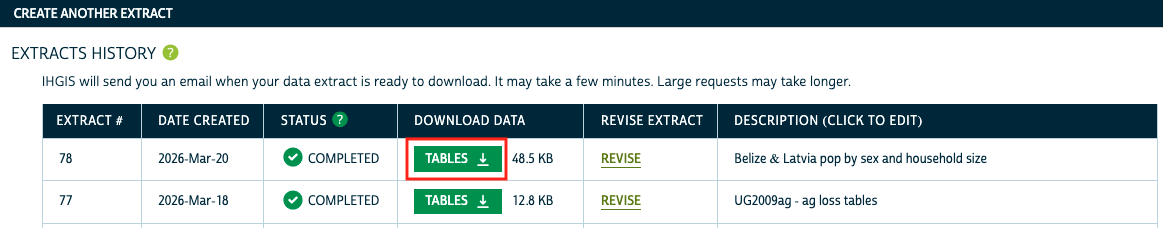
Clicking the “REVISE” link will return you to the extract builder with the selections for that extract in place, allowing you to make changes.
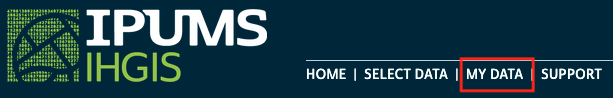
To access your Extracts History page from elsewhere in the system, click “MY DATA” from the top menu.
View Metadata
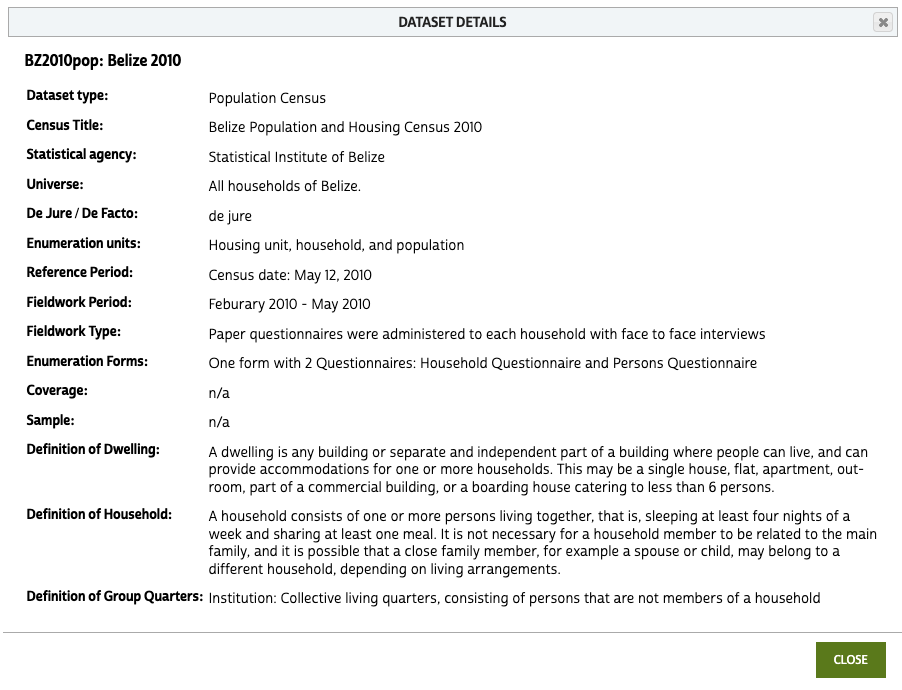
Metadata for datasets and tabulation geographies are available in the IHGIS Data Finder. The links in the Dataset and Tabulation Geographies columns of the Select Data grid open metadata pop-ups. The metadata in the pop-up provides details relevant to the table on the row from which the link was clicked. The metadata pop-ups are also accessible elsewhere in the system.
Dataset metadata provides basic information about the census and how it was conducted, including the type of census (population or agricultural), title of the census as it appears in the results documents, name of the agency that conducted the census, universe enumerated during the census, whether the census counted official residents (de jure) or all present (de facto), types of entities that were enumerated, census date or reference period used to define what was counted, fieldwork period during which forms and/or interviews were completed, type of fieldwork conducted, type(s) of forms used, notes on census coverage, and description of sampling (if applicable). The metadata also include definitions of dwellings, households, and group quarters.
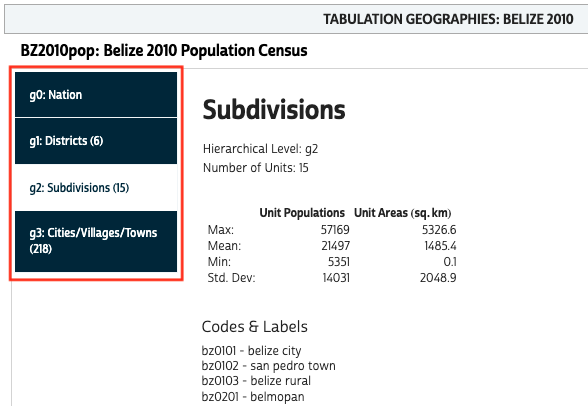
Tabulation geography metadata includes the name (e.g., states, provinces, districts), number of units, summary statistics for unit population and area, and a sampling of codes and labels. The codes and labels list is not exhaustive, but is intended to provide an indication of the type of units that make up the geography. This may be useful if you are familiar with the country and know the names of several of the units at the level you are looking for. You can switch between tabulation geographies within a dataset using the tabs on the side of the panel.