Return to User Guide Table of Contents
- Mapping with IHGIS Boundary Files
- Joining microdata sample tabulations to IPUMS International shapefiles
Mapping with IHGIS Boundary Files
IHGIS provides GIS shapefiles delineating the boundaries of the geographic units described in the data tables. The boundary files enable you to map data in the tables by linking them to the boundaries.
Download GIS boundary files
IHGIS boundary shapefiles are available from the Geography & GIS page. This page also provides more detailed information about IHGIS boundary shapefiles. If a dataset has more than one tabulation geography, for example, states and counties, a separate shapefile is provided for each geography. The links on the Geography & GIS page will download .zip files containing the component files that make up each shapefile. In future versions of IHGIS, boundary files will be available through the Data Finder.
Join data tables to boundary files
After downloading and unzipping a shapefile, you can open it in a GIS package. You can then join data from a data file to create a map. This video tutorial illustrates the process in ArcGIS using NHGIS data and shapefiles. The process is very similar for IHGIS data and shapefiles. The steps below use QGIS (a free, open source GIS package). The process and concepts will be similar in other GIS packages.
- Add both the shapefile and data table to a map. For this example, we will map division population density in Kenya using the Kenya 2019 division (g3) shapefile from the Geography & GIS page and the “Population by Sex, Households by Conventional/Group Quarters, Land Area, and Population Density” table (ABN) from the Data Finder. (In QGIS, you should add the data table using the Add Delimited Text Layer dialog to ensure that data values are treated as numeric rather than strings.)
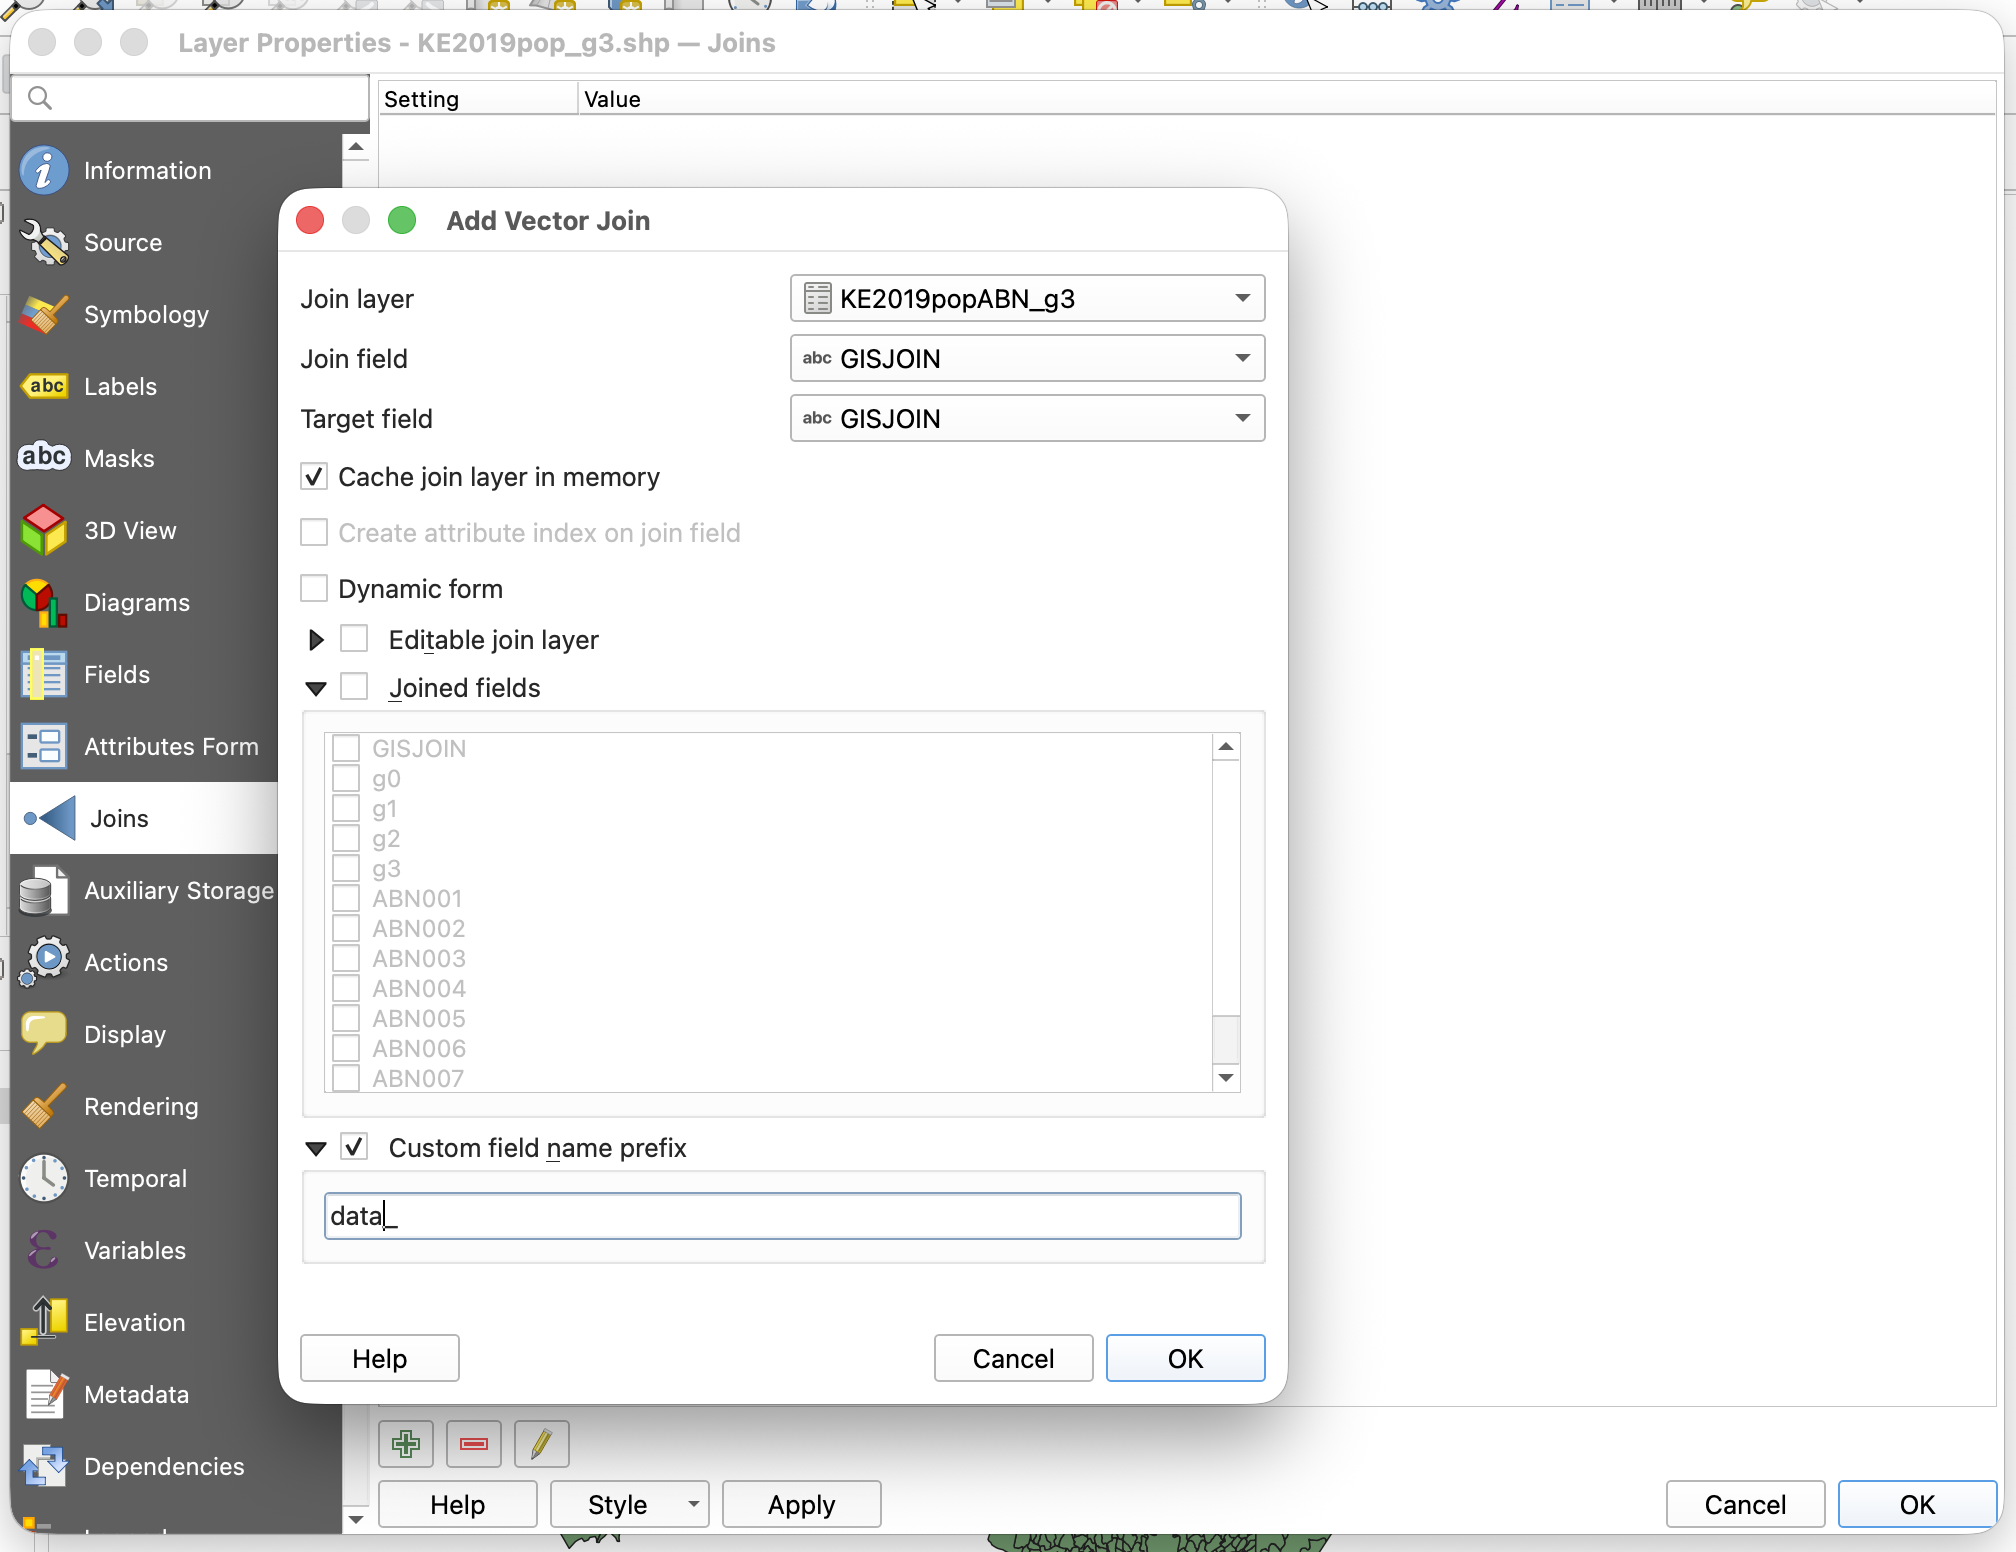
- Open the properties for the shapefile and go to the Joins panel.
- Add a new join, with the data file (KE2019pop_ABN_g3) as the join layer and GISJOIN as both the Join field and Target field. You may want to change the Custom field name prefix to something shorter than the file name, like "data_".
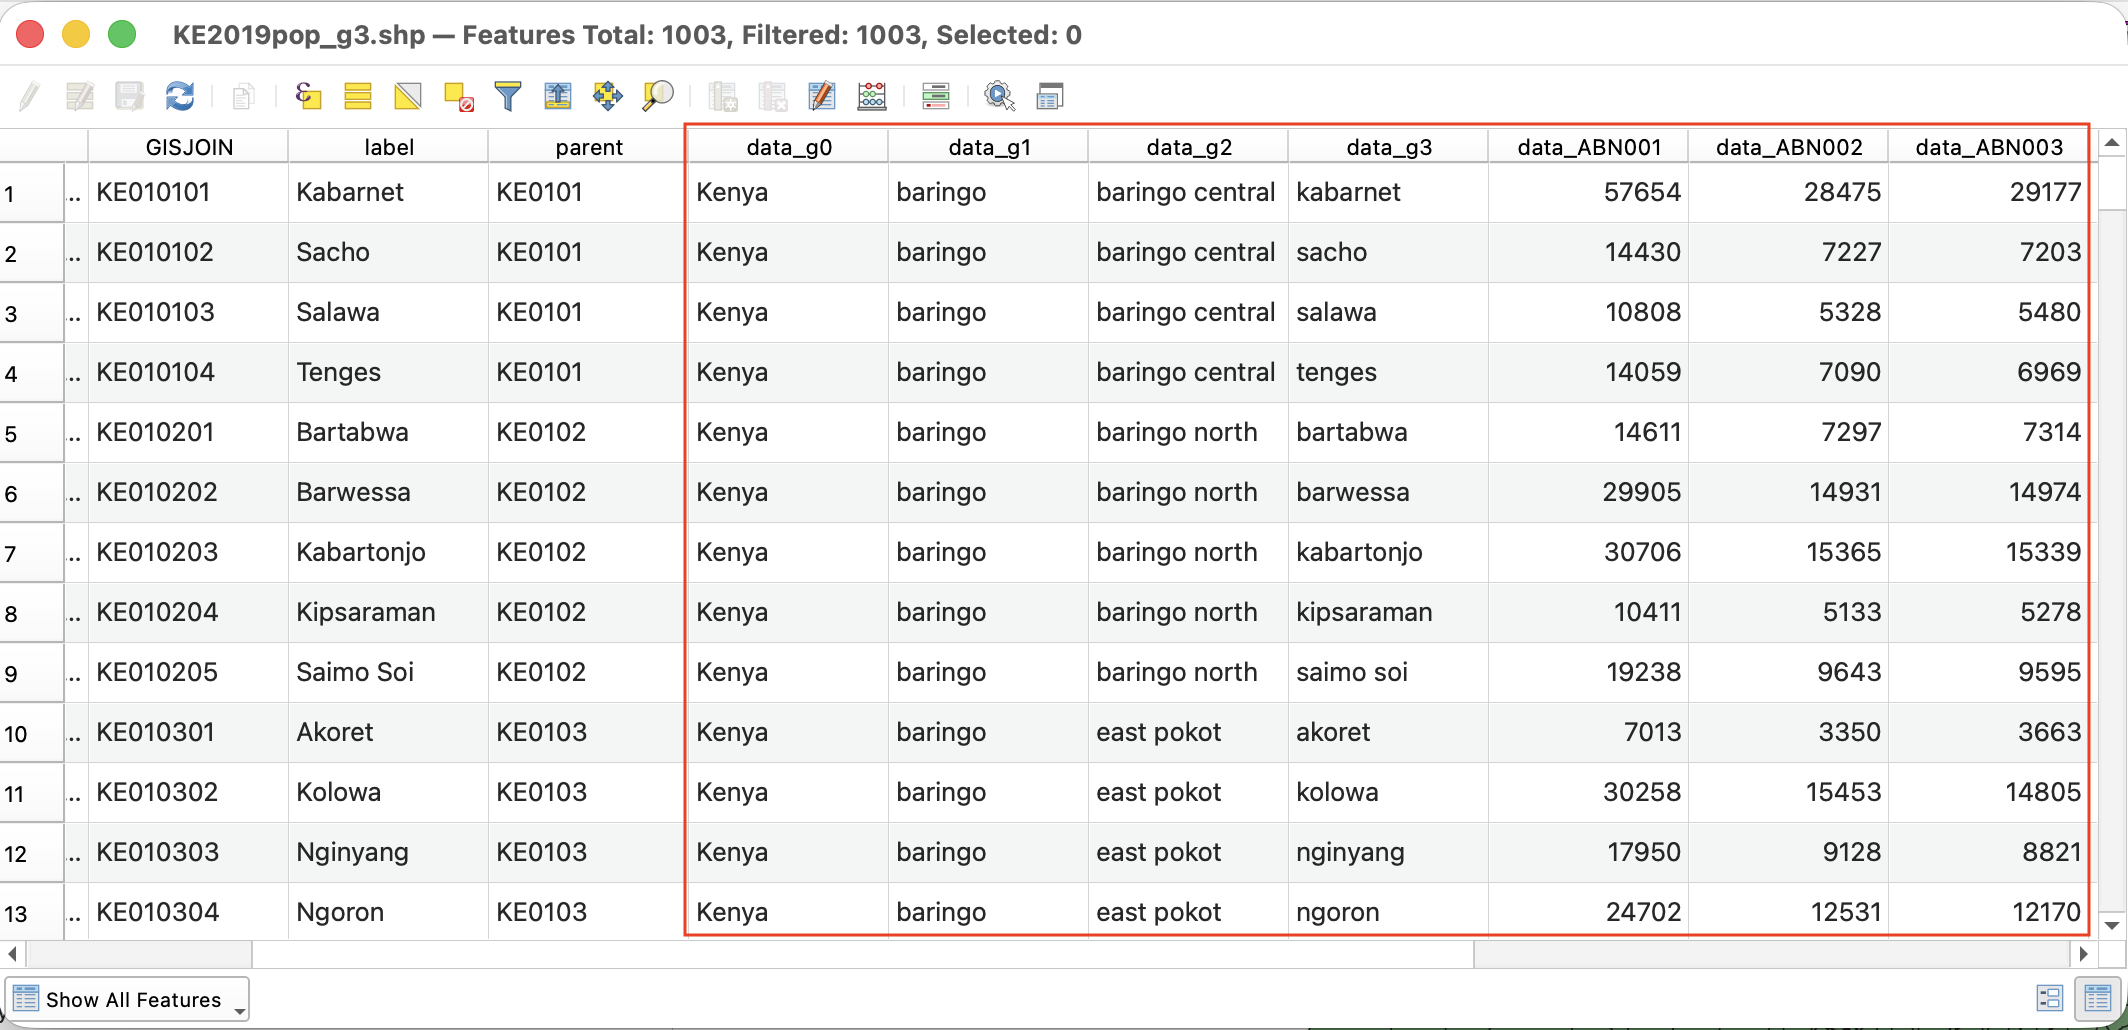
The attribute table for the shapefile should now include columns from the data table. Note that the names of the units in the 'label' field in the shapefile match the 'data_g3' field from the data table. The 'data_ABNxxx' columns are the data from the table. The codebook.txt and datadict.csv metadata files included with your extract contain the full headers and other metadata describing the contents of the columns.
Make a basic map
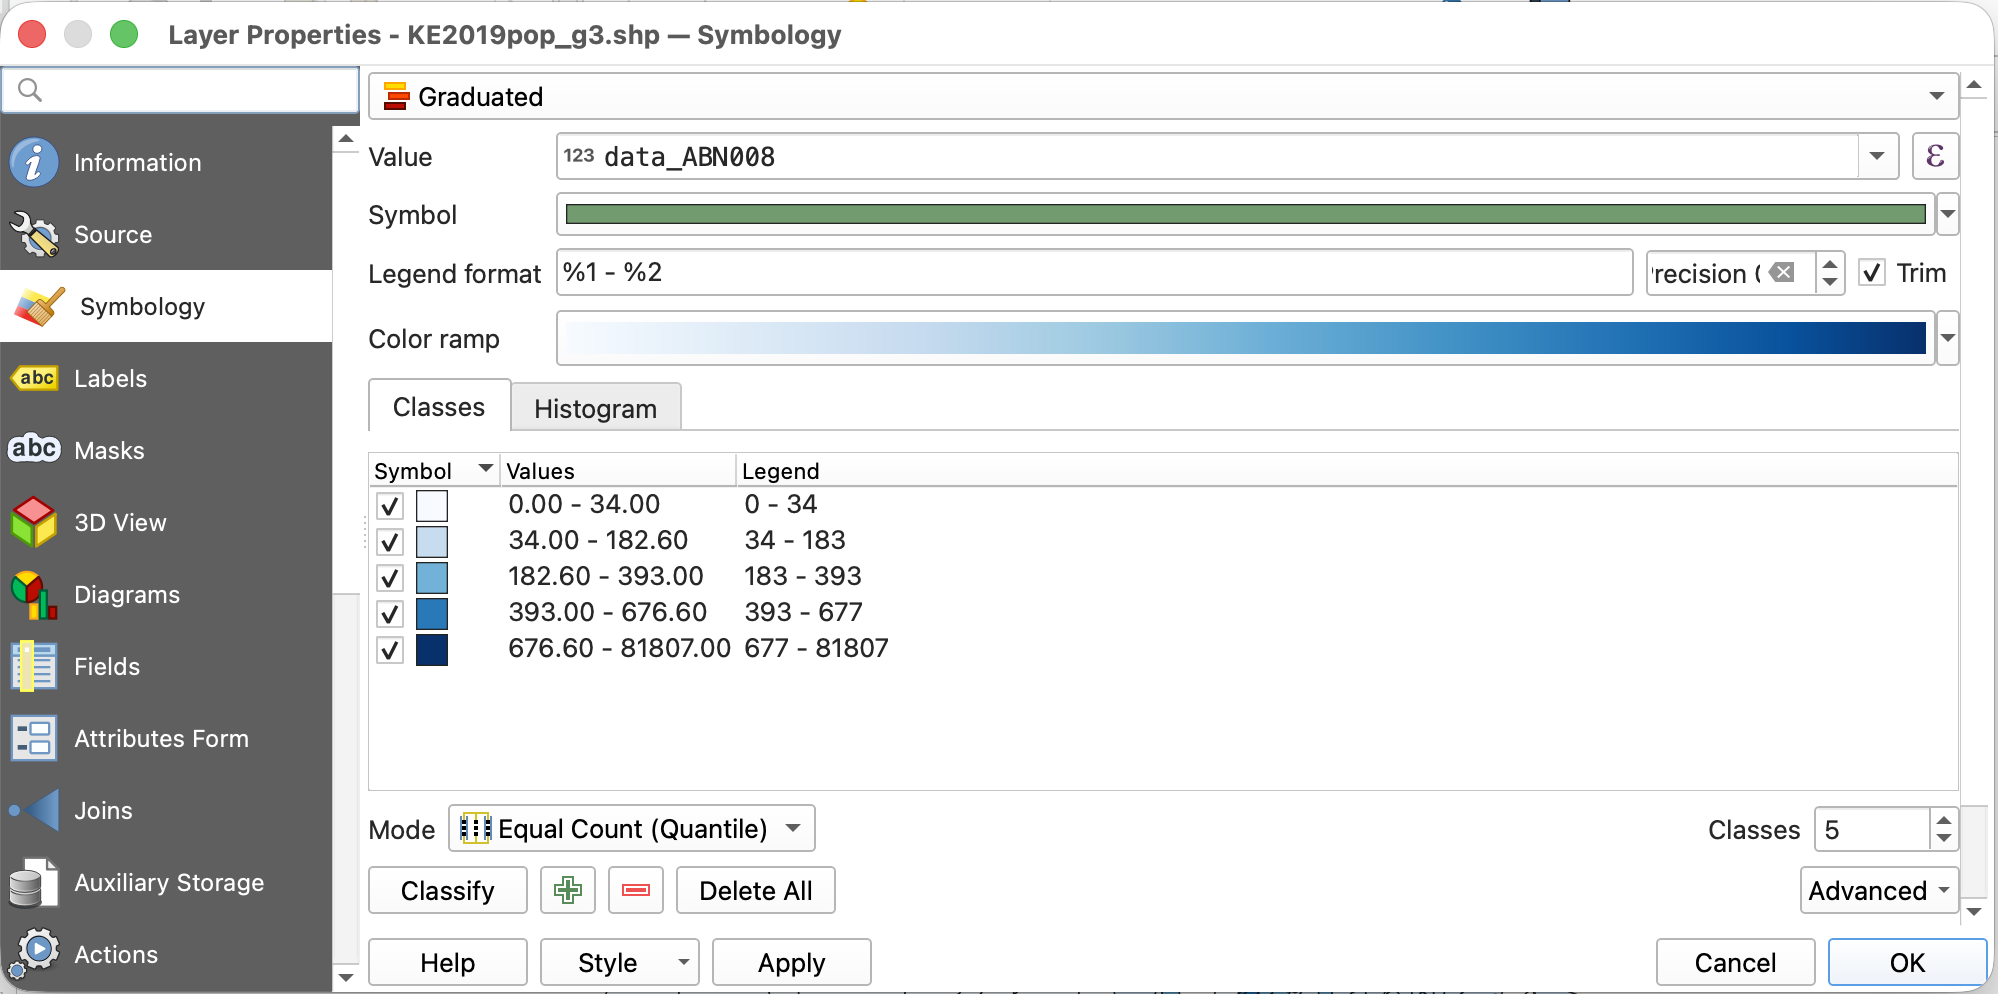
To map a variable, open the properties for the shapefile and go to the Symbology panel. For a numeric variable, select Graduated, then select the variable column you want to display. Select the number of classes, color ramp, classification mode, and any other options. For example, we have chosen to map the population density variable (ABN008) with a light-to-dark blue color ramp classified into 5 categories using the "Equal Count (Quantile)" method.
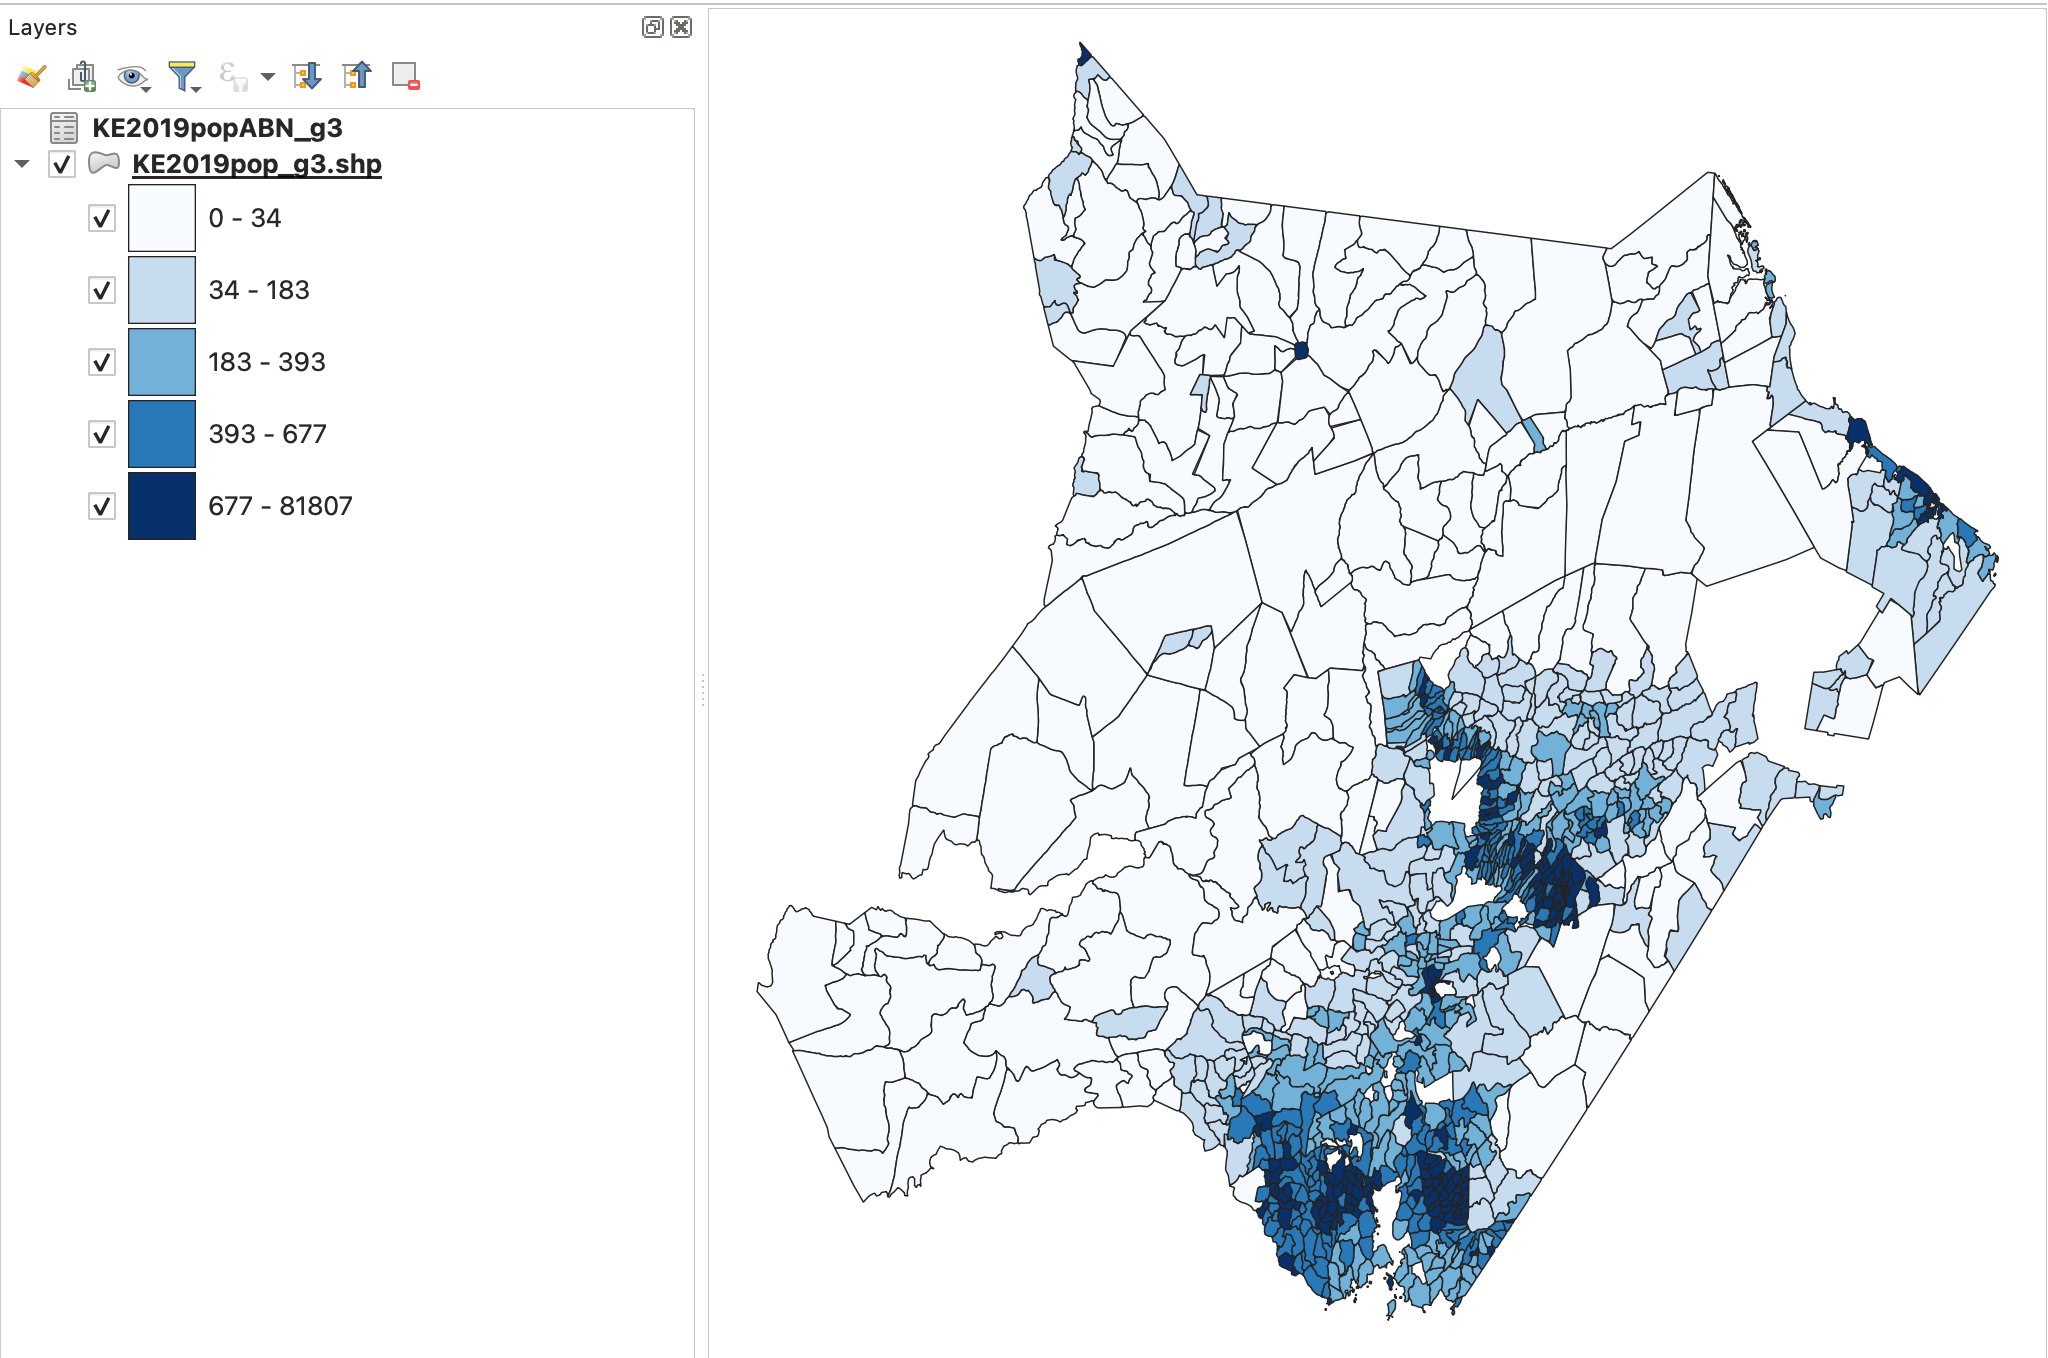
We now have a map showing population density for the divisions of Kenya in 2019. It is clear from this map that the areas with the highest population density are in a band from northeast to southwest in the eastern part of the country, while nearly all of the western half of the country has very low population densities.
Joining microdata sample tabulations to IPUMS International shapefiles
IHGIS data tabulated from IPUMS International microdata samples can be joined to boundary files available from the IPUMS International GIS Boundary Files page. IHGIS data files with "g1" or "g2" in the file name correspond to IPUMS International year-specific boundaries. IHGIS data files with "ga" or "gb" in the file name correspond to IPUMS International harmonized boundaries.
Due to differences in naming and coding conventions, IPUMS International shapefiles do not include GISJOIN fields that can be used directly to join to IHGIS data tables. You can, however, construct fields that can be used to join data tables to boundaries based on available information.
Joining g1 Tables to Year-specific Boundaries
Create a new field in the shapefile attribute table that concatenates the 2-character country code with the IPUMyyyy (where yyyy is the year) field in the shapefile. For example, for the Austria 1991 dataset, the formula for the new field in QGIS is, concat('AT',"IPUM1991"). The data table can then be joined based on GISJOIN in the data table and the new field in the shapefile.
Joining g2 Tables to Year-specific Boundaries
There is some inconsistency among datasets for g2 coding conventions. One of the following methods should work.
Method 1: Create a new field in the IHGIS data table that consists of the last 6 digits in the GISJOIN code. Be sure the new field is created as a text field to retain any leading zeroes. For example, for the Austria 1991 dataset, the formula for the new field in QGIS is, right("GISJOIN", 6). This new field can then be joined to the IPUMyyyy field in the shapefile.
Method 2: Create a new field in the shapefile attribute table that concatenates the 2-character country code, the PARENT field, and the field containing level-specific unit codes. (This final field will have a name based on the name of the geographic level, e.g., for Benin, the g2 level is communes and the name of the field is like COMN1992.) For example, for the Benin 1992 dataset, the formula for the new field in QGIS is, concat('BJ',"PARENT","COMN1992"). This new field can then be joined to the GISJOIN field in the IHGIS data file.
Joining ga or gb Tables to Harmonized Boundaries
Create a new field in the shapefile attribute table that concatenates the 2-character country code with the GEOLEVEL<1/2> field in the shapefile. For example, for the Benin 1992 harmonized 2nd level, the formula in QGIS is, concat('BJ', "GEOLEVEL2"). The new field can then be joined to the GISJOIN field in the data table.
Note that the tabulated data in IHGIS are based on IPUMS International data as as of September 2018. In some cases, the IHGIS data tables may not align with the current shapefiles. If you encounter such a case, please let us know by emailing [email protected].